Adsorption of oleate on fluorite surface as revealed by atomic force microscopy
K. Chennakesavulu, G. Bhaskar Raju,⁎, S. Prabhakar, C. Madhavan Nair, K.V.G.K. Murthy
Abstract
The adsorption of oleic acid / oleate on fluorite surface could be visualized using tapping mode of atomic force
microscopy (AFM). The natural fluorite crystals were equilibrated with 10minus;3 to 10minus;7 M oleate solutions and their AFM images at each concentration along with height profiles were recorded. Even at low oleate concentration of 1times;10minus;7 M, concomitant monolayer and bilayer structures were observed. It suggests that normal–normal bonding of hydrocarbon chains takes place before the surface is completely covered by the monolayer. Multi-layer adsorption of oleate was observed at oleate concentrations of above 10minus;4 M. The tapping mode AFM can be utilized to visualize the topography of surfaces adsorbed with surfactant molecules.
Introduction
Over the years, many researchers had attempted to understand the mechanism of fatty acid adsorption and selective separation of calcium minerals by flotation. A comprehensive review on the interaction of oleic acid on mineral surface was published by Hanna and Somasundaran (1976) and Finkelstein (1989). Based on the experimental conditions employed, different mechanisms such as physisorption, chemisorption, surface precipitation, chemisorption followed by the surface precipitation and chemisorption followed by the formation of hydrophobic aggregates have been reported. The initial study (Somasundaran et. al., 1964) suggested that the long chain surfactants are adsorbed as individual counter ions at low concentrations and as hemi-micelles beyond certain equilibrium concentration. By considering the surface heterogeneities, Cases et al. (1986) proposed the condensation of surfactant at the homogeneous domains with most energetic sites at low concentrations followed by successive two dimensional condensations on less energetic domains. Hence in the monolayer range, the isotherm exhibits either a series of small vertical steps or a smooth curve depending on the distribution of surface energetic domains. Hanumantha Rao et al (1991a, b) have extensively studied the interaction of oleate on calcium minerals by adsorption, zeta potential and IR spectroscopy as well as theoretical thermodynamic calculations. The authors have observed monolayer coverage in the case of calcite and a bilayer formation in the cases of fluorite, apatite, baryte and scheelite, prior to the precipitation of calcium soap. The adsorption of oleate on apatite was investigated by ex-situ FT-IR internal reflection spectroscopy and found that the adsorbent is predominantly in the form of oleic acid at pH 8.0 and as oleate at pH 9.5 (Yongqiang Lu et al., 1998). The adsorption of oleate was also studied using infrared reflection technique (DRIFT) and the solution depletion method (Mielczarski, et. al., 2000). Agreement between spectroscopic data collected directly from the mineral surface and adsorption isotherms obtained by the depletion method was established by considering the formation of liquid crystals and calcium-sodium oleate micelles in solution. The interaction of calcium dioleate collector colloids with calcite and fluorite surface was studied by AFM and molecular dynamics simulation (Keqing Fa et al., 2006). Better flotation response of fluorite compared to calcite was explained in terms of interfacial water structures at fluoritewater and calcite-water interface. The density of interfacial water at the fluorite surface was observed to be low whereas tightly packed monolayer structures with high hydration were observed in the case of calcite.
In the present study, tapping mode atomic force microscopy was used to visualize the adsorption of oleate molecules at fluorite–water interface.
- Materials and methods
2.1. Materials
study was 97% pure and was obtained from Acros Organics, U.S.A. The oleic acid was converted to sodium oleate and the dilute solution of known concentration was used. Dilute solutions of HCl and NaOH were used to adjust the pH of the mineral suspension.
2.2. Experimental methods
The pure fluorite crystals were cut to the required size and polished with velvet cloth applying diamond and alumina paste. After polishing, the samples were thoroughly washed with double distilled water. After equilibrating the samples with oleate solutions for half an hour, the samples were taken out from oleate solution and dried at 100 °C in oven. AFM images were collected with a commercial instrument, Nano-scope III a (Veeco, Santa Barbara, CA). All the images were collected in air by tapping mode AFM using Phosphorus (n) doped silicon cantilever probe at 1 Hz scan rate and 256 lines per sample.
3. Results and discussion
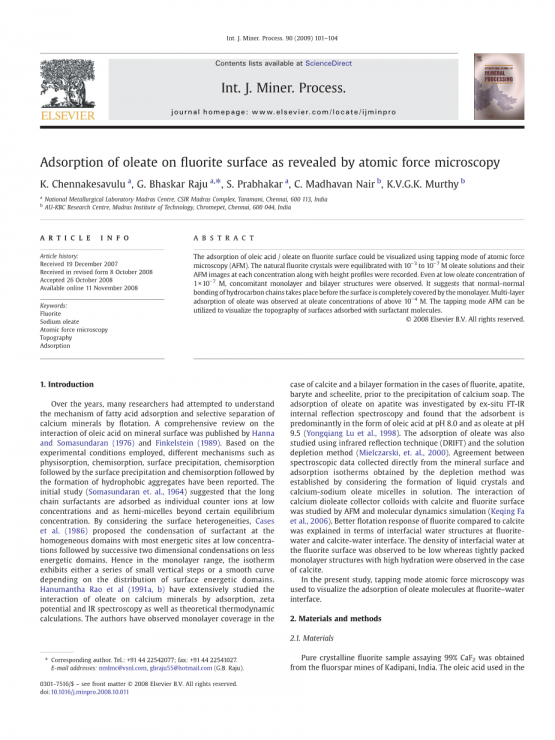
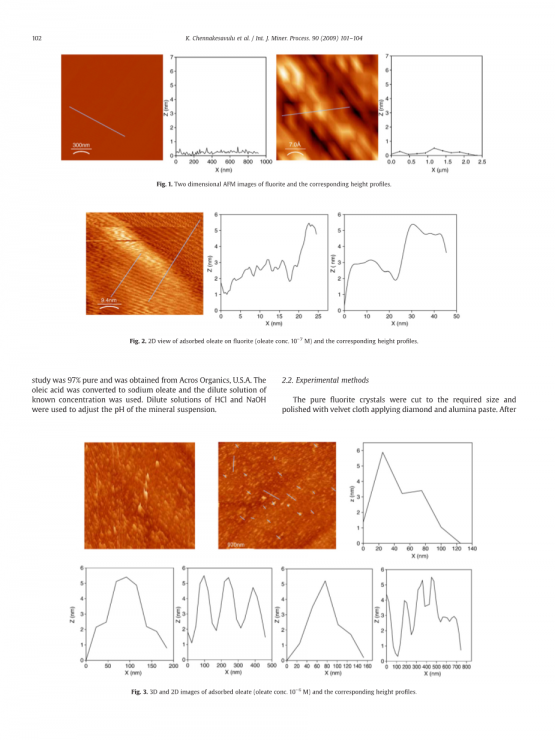
The tapping mode was reported to be reliable to examine the topography of the mineral under ambient conditions (Kalfaoui et al.,2006). The AFM image showing the surface morphology of fluorite crystal obtained using tapping mode AFM along with height profile are shown in Fig. 1. The image clearly exhibits the hexagonal arrangement of atoms on the fluorite surface. Such hexagonal arrangement of F-ions in CaF2 was also observed by Engelhardt et al. (2000). From the height profiles (0.3 nm) it is apparent that the fluorite surface is uniform. The AFM images of fluorite crystals equilibrated with different initial oleate concentrations were shown in Figs. 2–5.
The concentration of oleate was varied from 1times;10minus;7 to 1times;10minus;3M. The height profiles of the fluorite sample equilibrated at 1 times;10minus;5 M and below olea


英语原文共 4 页
资料编号:[6030]
以上是毕业论文外文翻译,课题毕业论文、任务书、文献综述、开题报告、程序设计、图纸设计等资料可联系客服协助查找。


