International Review of Economics and Finance 15 (2006) 97 – 119
Long-run abnormal performance following convertible preference share and convertible bond issues:
New evidence from the United Kingdom
Abhay Abhyankara, Keng-Yu Hob,T
aDurham Business School, University of Durham, Durham DH1 3LB, United Kingdom
bDepartment of Finance, National Central University, Taoyuan 320, Taiwan
Received 22 January 2003; received in revised form 3 March 2004; accepted 29 March 2004
Available online 31 May 2004
Abstract
We study the long-run abnormal performance of a sample of U.K. firms following convertible preference share and convertible bond issues over the period 1982–1996. We are the first to study, as far as we are aware, the long- run stock price performance of firms following convertible preference share issues. Furthermore, our data set has been extracted from original sources and thus mitigates to some extent concerns about data-snooping biases. We measure long-run abnormal performances both prior to and following the issuance of convertible bonds and convertible preference shares and by the method of the issue used. Using a range of metrics to assess the robustness of long-run abnormal performance, we find evidence of pre-offer overperformance and post-offer underperformance using buy-and-hold abnormal returns (BHARs). However, post-offer underperformance is statistically significant in the case of convertible preference share issuers. Implementing a calendar-time approach, we again find underperformance for convertible preference share issuers. We do not find any evidence of long-run stock price underperformance for firms following the issuance of convertible bonds.
D 2004 Elsevier Inc. All rights reserved.
JEL classification: G00; G14; G30
Keywords: Convertible preference share; Convertible bond; Long-run abnormal performance; Event study
T Corresponding author. Tel.: 886 3 4227151x6263; fax: 886 3 425 2961.
E-mail address: kengyuho@cc.ncu.edu.tw (K.-Y. Ho).
1059-0560/$ - see front matter D 2004 Elsevier Inc. All rights reserved. doi:10.1016/j.iref.2004.03.001
- Empirical results
We begin by reporting our results for the pre-offer abnormal performance of convertible security issuers and then focus on our main results for the long-horizon post-offer abnormal performance based on both BHAR and CTAR.
We use two benchmarks, the FTSE All-Share Index and size/book-to-market-matched portfolios, to calculate the BHARs. However, we focus our discussion of the empirical results mainly on BHARs using size/book-to-market-matched portfolios as benchmarks (see, e.g., Fama amp; French, 1992, 1993). We also calculate both value- and equal-weighted abnormal returns. As suggested by Fama (1998), value-weighted returns provide a measure of the aggregate wealth effects experienced by investors, whereas the equal-weighted returns, as argued by Loughran and Ritter (1995) measure the abnormal performance of a firm undergoing a particular event.
- Pre-offer abnormal performance
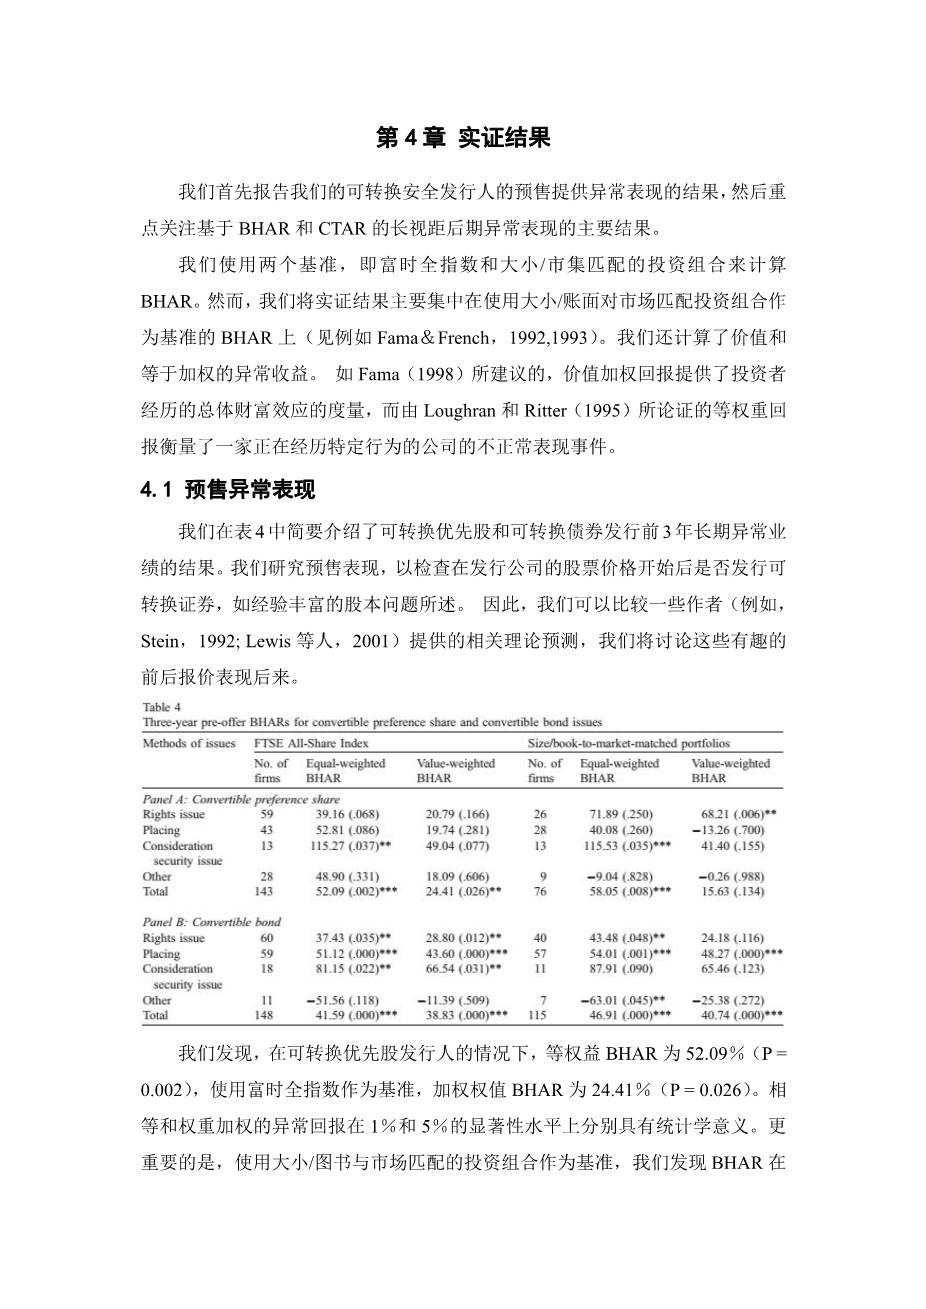
We briefly present in Table 4 our results for the long-run abnormal performance 3 years prior to the convertible preference share and convertible bond issues. We study pre-offer performance to examine whether convertible securities are issued following a run-up in the stock price of issuing firms, as noted in the case of seasoned equity issues. We are able to, as a result, compare pre- and post-offer
Table 4
Three-year pre-offer BHARs for convertible preference share and convertible bond issues
Methods of issues FTSE All-Share Index Size/book-to-market-matched portfolios
No. of firms | Equal-weighted BHAR | Value-weighted BHAR | No. of firms | Equal-weighted BHAR | Value-weighted BHAR | |
Panel A: Convertible preference share | ||||||
Rights issue | 59 | 39.16 (.068) | 20.79 (.166) | 26 | 71.89 (.250) | 68.21 (.006)TT |
Placing | 43 | 52.81 (.086) | 19.74 (.281) | 28 | 40.08 (.260) | -13.26 (.700) |
Consideration | 13 | 115.27 (.037)TT | 49.04 (.077) | 13 | 115.53 (.035)TTT | 41.40 (.155) |
security issue | ||||||
Other | 28 | 48.90 (.331) | 18.09 (.606) | 9 | -9.04 (.828) | -0.26 (.988) |
Total | 143 | 52.09 (.002)TTT | 24.41 (.026)TT | 76 | 58.05 (.008)TTT | 15.63 (.134) |
Panel B: Convertible bond
Rights issue | 60 | 37.43 (.035)TT | 28.80 (.012)TT | 40 | 43.48 (.048)TT | 24.18 (.116) |
Placing | 59 | 51.12 (.000)TTT | 43.60 (.000)TTT | 57 | 54.01 (.001)TTT | 48.27 (.000)TTT |
Consideration | 18 | 81.15 (.022)TT | 66.54 (.031)TT | 11 | <td


