A Study on Information Transfer of International Crude Oil Futures Price Base on V AR-GARCH-BEKK Model
Xiao Longjie
Abstract-Crude oil future price plays an important role in the world oil price mechanism. The crude oil future price changes will transfer information to other oil market through Volatility Spillover Effects, so the crude oil future price has been the focus of attention.From the situation of recent years, the oil future market develops rapidly and future markets play a price in the discovery function in some way. The future price has become a benchmark in oil market. In order to further reveal the price formation mechanism, the transmission and market efficiency of the oil future markets, as well as the efficiency of information transfer between the future and spot market, this paper is based on the analysis of theories and methods. It selects the NYMEX WTI crude oil future prices and WTI crude oil spot price for representative to analyze the price volatility characteristics, basic statistical characteristics of earnings, and long-run equilibrium relationship between the two markets.
The WTI crude oil futures contract in NYMEX is one of the world's most actively traded oil futures. The light sweet crude oil futures contract launched by NYMEX (currently trading liquidity largest oil platform) is currently one of the world's largest volume commodities. The object of this paper is WTI crude oil futures (Cushing, OK Crude Oil Future Contract 1) and WTI crude oil spot price FOB in US Cushing, Oklahoma (Cushing, OK WTI Spot Price FOB). The unit is dollars per barrel and the data sample interval is from January 2, 1997 to December 31, 2013. We obtained 4435 common trading day data excluding the two market business days, inconsistent data. All the data is from Energy Information Administration (EIA).
Considering the oil price fluctuation in recent years and the amplitude relatively is large, this paper uses the kernel density estimation method to estimate volatility distribution characteristics of crude oil future price. The standard kernel density estimation formula l is as follow:
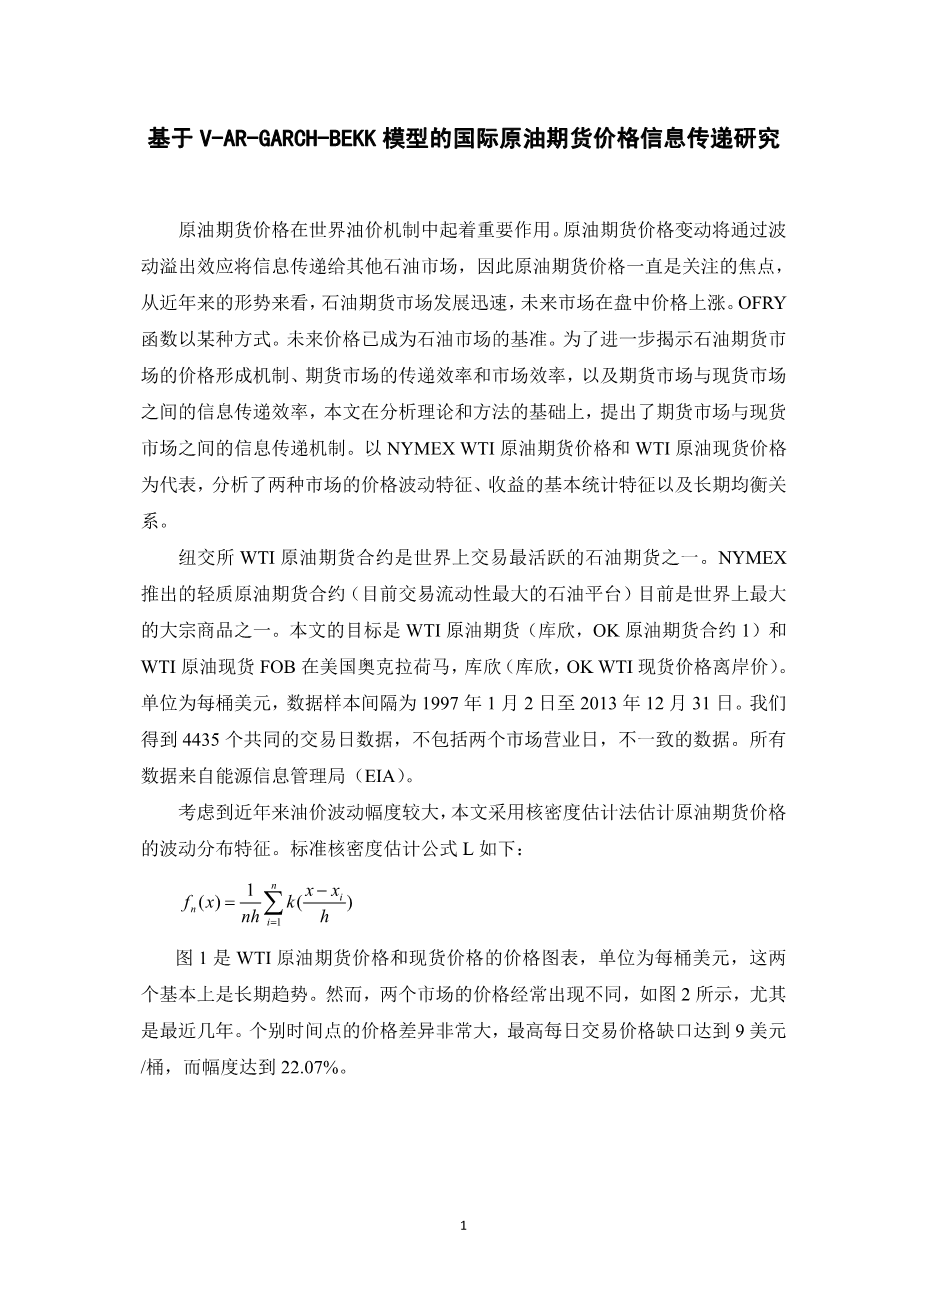
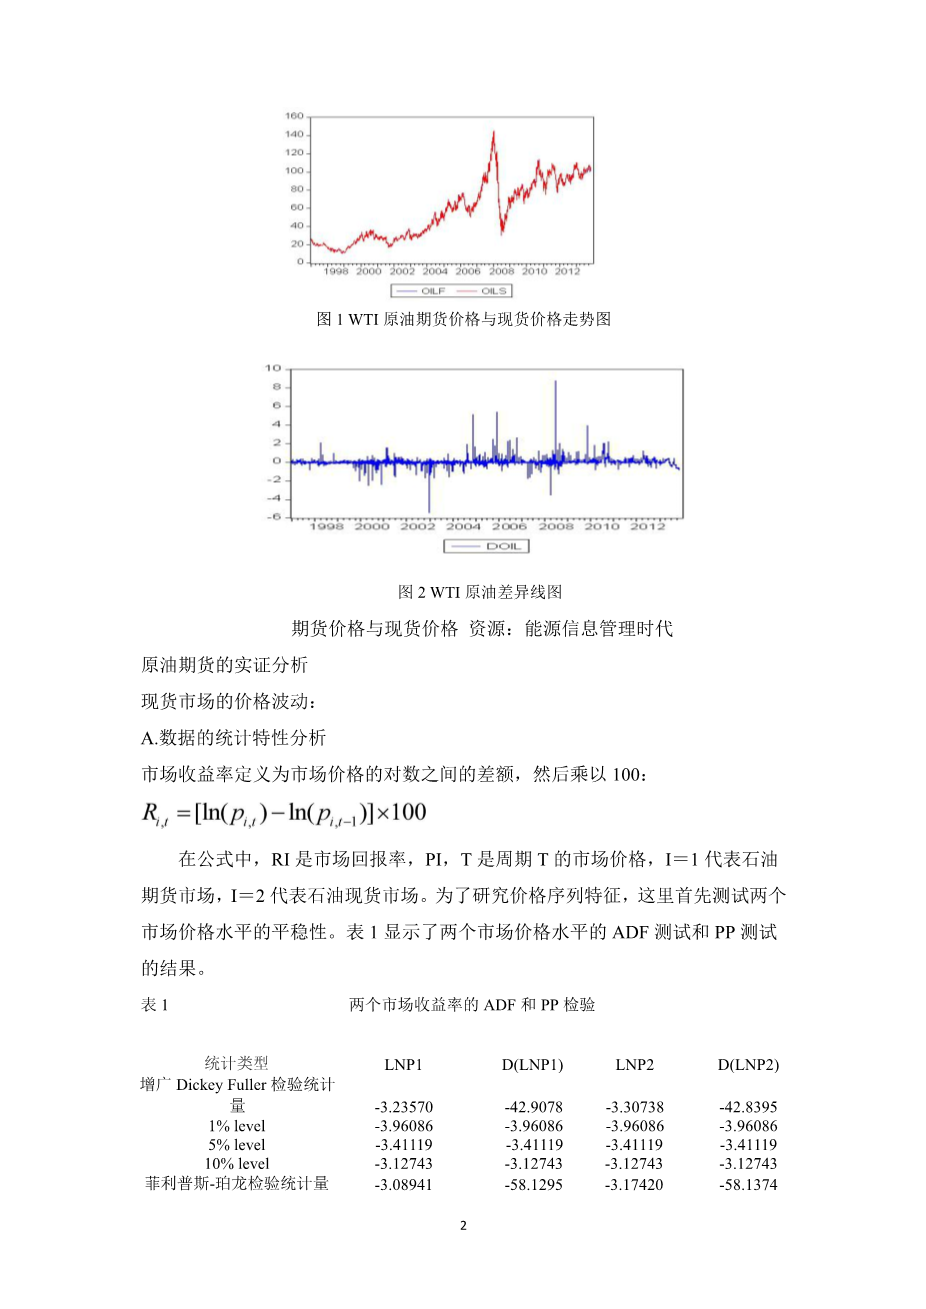
Figure 1 is the price chart of WTI crude oil future price and spot price, the unit is dollars per barrel, the two are basically the same trend in for the long term. However, the price of the two markets appear different frequently as can be seen in Figure 2, especially for the last few years. The price difference is very large at individual time points, the maximum daily trading price gap reached $9/barrel, while the magnitude reached 22.07%.
FIGURE 1 THE PRICE CHART OF WTI CRUDE OIL FUTURES PRICE AND SPOT PRICE
FIGURE 1 THE LINE GRAPH OF THE DIFFERENCE BETWEEN WTI CRUDE OIL
FUTURES PRICE AND SPOT PRICE
RESOURCE: ENERGY INFORMATION ADMINlSTRATION, ErA
- EMPIRICAL ANALYSIS OF CRUDE OIL FUTURES
PRICE VOLATILITY ON THE SPOT MARKET
- The statistical characteristics analysis of the data
The market yield is defined as the difference between the logarithm of the market price, then multiply 100:
In the formula,ri t is the market return, pi,t is the market price of period t,i=1 represents oil futures market, i=2 represents oil spot market.In order to investigate the price sequence features,here first test the stationary of the two market price level. Table 1 shows the results of the ADF test and PP test of the two market price level.
TABLE 1 THE ADF AND PP TEST OF TWO MARKET RETURN
type of examination | LNP1 | D(LNP1) | LNP2 | D(LNP2) |
Augmented Dickey-Fuller test statistic | -3.23570 | -42.9078 | -3.30738 | -42.8395 |
1% level | -3.96086 | -3.96086 | -3.96086 | -3.96086 |
5% level | -3.41119 | -3.41119 | -3.41119 | -3.41119 |
10% level | -3.12743 | -3.12743 | -3.12743 | -3.12743 |
Phillips-Perron test statistic | -3.08941 | -58.1295 | -3.17420 | -58.1374 |
1% level | -3.96086 | -3.96086 | -3.96086 | -3.96086 |
5% level | -3.41119 | -3.41119 | -3.41119 | -3.41119 |
10% level | -3.12743 | -3.12743 | -3.12743 | -3.12743 |
Table 1 shows that all the ongrnal sequence of the vanable can not refuse the hypothesis of the existence of a unit root. In addition, the first difference sequence of the variable can significantly refuse the hypothesis of the existence of a unit root; and be a smooth sequence. This means the first difference sequence of the variable is integrated of order one I (1). As the degree of integration is same, these variables may exist in co integration. Next, perform the characteristic analysis of the return sequence, in order to investigate the basic characteristic of the two market return sequence.
Return sequences appear as a plurality of abnormal peak, which illustrates the volatility of return is paroxysmal and significant. In addition, the abnormal volatility are relatively concentrated in a certain period, that is the return of the two market have obvious volatility clustering phenomenon (ARCH effect). Return square sequences have volatility clustering phenomenon, which means the return of the two markets; there exist heteroscedasticity signs.
TABLE 2 THE BASIC STATISTICAL CH
剩余内容已隐藏,支付完成后下载完整资料


英语译文共 6 页,剩余内容已隐藏,支付完成后下载完整资料
资料编号:[469247],资料为PDF文档或Word文档,PDF文档可免费转换为Word


