
英语原文共 6 页,剩余内容已隐藏,支付完成后下载完整资料
外 文 翻 译(原 文)
Data Structures
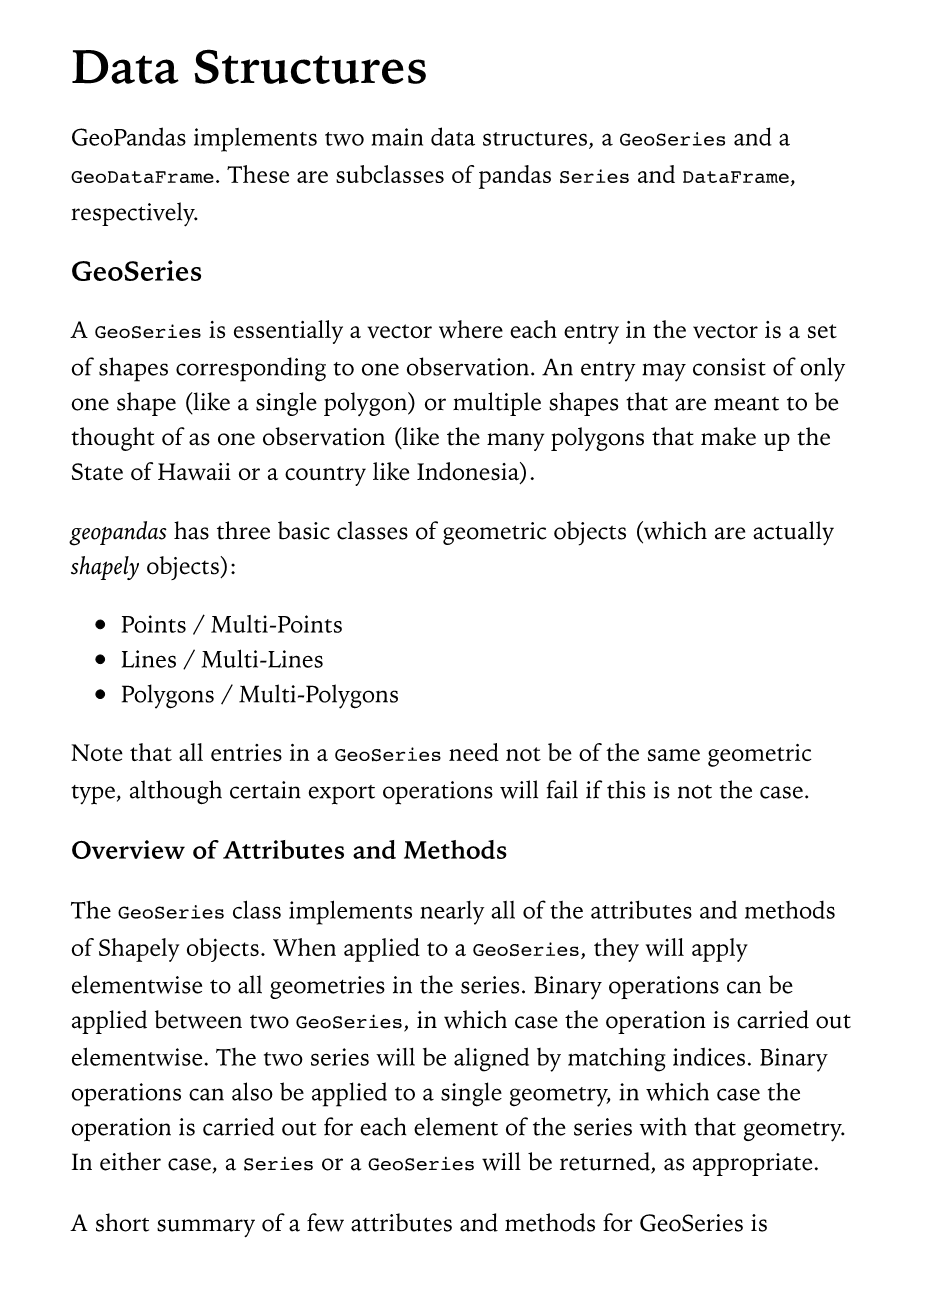
GeoPandas implements two main data structures, a GeoSeries and a GeoDataFrame. These are subclasses of pandas Series and DataFrame, respectively.
GeoSeries
A GeoSeries is essentially a vector where each entry in the vector is a set of shapes corresponding to one observation. An entry may consist of only one shape (like a single polygon) or multiple shapes that are meant to be thought of as one observation (like the many polygons that make up the State of Hawaii or a country like Indonesia).
geopandas has three basic classes of geometric objects (which are actually shapely objects):
- Points / Multi-Points
- Lines / Multi-Lines
- Polygons / Multi-Polygons
Note that all entries in a GeoSeries need not be of the same geometric type, although certain export operations will fail if this is not the case.
Overview of Attributes and Methods
The GeoSeries class implements nearly all of the attributes and methods of Shapely objects. When applied to a GeoSeries, they will apply elementwise to all geometries in the series. Binary operations can be applied between two GeoSeries, in which case the operation is carried out elementwise. The two series will be aligned by matching indices. Binary operations can also be applied to a single geometry, in which case the operation is carried out for each element of the series with that geometry. In either case, a Series or a GeoSeries will be returned, as appropriate.
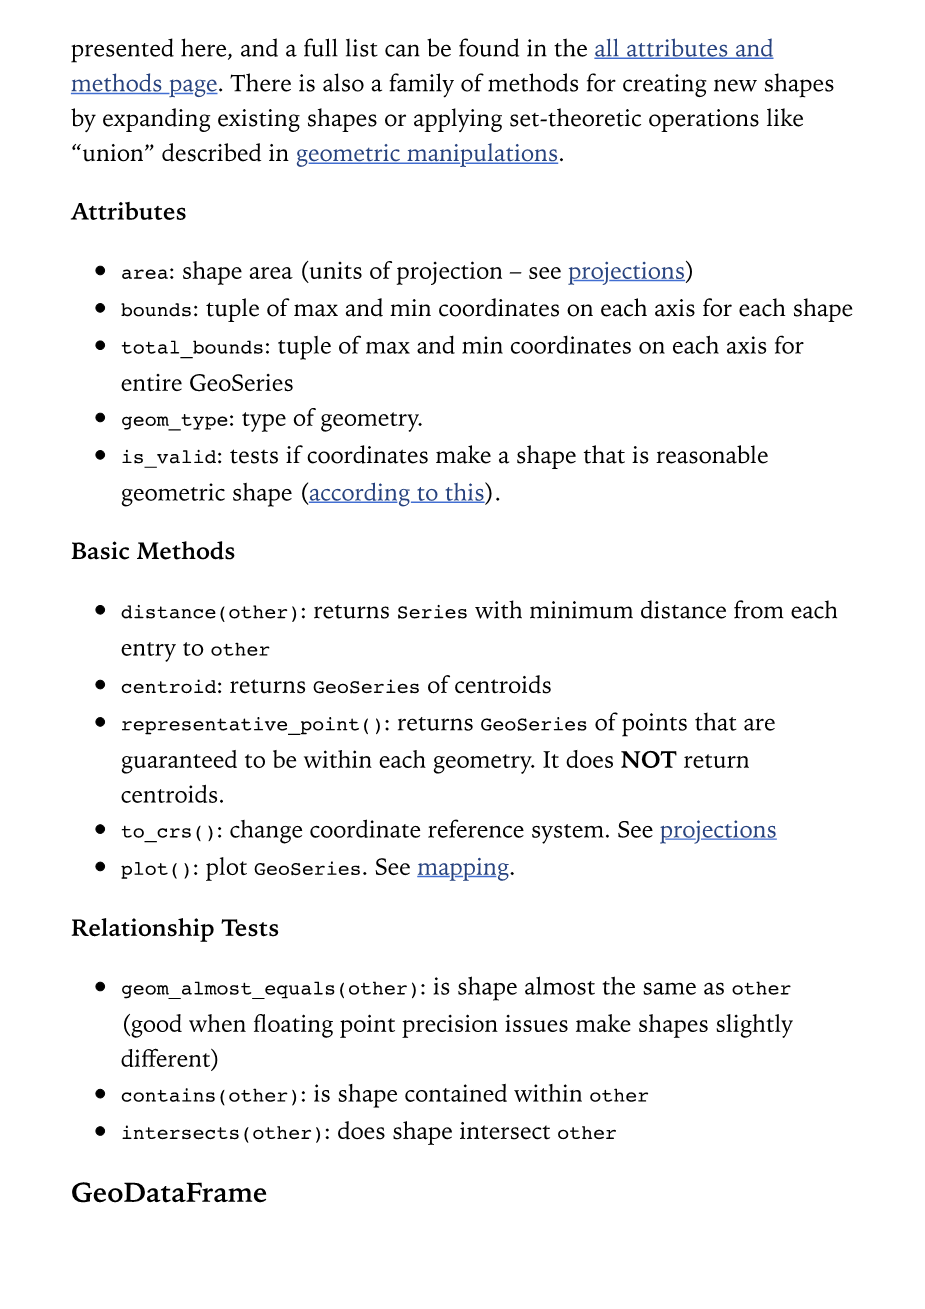
A short summary of a few attributes and methods for GeoSeries is presented here, and a full list can be found in the all attributes and methods page. There is also a family of methods for creating new shapes by expanding existing shapes or applying set-theoretic operations like “union” described in geometric manipulations.
Attributes
- area: shape area (units of projection – see projections)
- bounds: tuple of max and min coordinates on each axis for each shape
- total_bounds: tuple of max and min coordinates on each axis for entire GeoSeries
- geom_type: type of geometry.
- is_valid: tests if coordinates make a shape that is reasonable geometric shape (according to this).
Basic Methods
- distance(other): returns Series with minimum distance from each entry to other
- centroid: returns GeoSeries of centroids
- representative_point(): returns GeoSeries of points that are guaranteed to be within each geometry. It does NOT return centroids.
- to_crs(): change coordinate reference system. See projections
- plot(): plot GeoSeries. See mapping.
Relationship Tests
- geom_almost_equals(other): is shape almost the same as other (good when floating point precision issues make shapes slightly different)
- contains(other): is shape contained within other
- intersects(other): does shape intersect other
GeoDataFrame
A GeoDataFrame is a tabular data structure that contains a GeoSeries.
The most important property of a GeoDataFrame is that it always has one GeoSeries column that holds a special status. This GeoSeries is referred to as the GeoDataFramersquo;s “geometry”. When a spatial method is applied to a GeoDataFrame (or a spatial attribute like area is called), this commands will always act on the “geometry” column.
The “geometry” column – no matter its name – can be accessed through the geometry attribute (gdf.geometry), and the name of the geometry column can be found by typing gdf.geometry.name.
A GeoDataFrame may also contain other columns with geometrical (shapely) objects, but only one column can be the active geometry at a time. To change which column is the active geometry column, use the set_geometry method.
An example using the worlds GeoDataFrame:
In [1]: world = gpd.read_file(gpd.datasets.get_path(#39;naturalearth_lowres#39;))
In [2]: world.head()Out[2]: pop_est continent name iso_a3 gdp_md_est \0 28400000.0 Asia Afghanistan AFG 22270.0 1 12799293.0 Africa Angola AGO 110300.0 2 3639453.0 Europe Albania ALB 21810.0 3 4798491.0 Asia United Arab Emirates ARE 184300.0 4 40913584.0 South America Argentina ARG 573900.0
geometry 0 POLYGON ((61.21081709172574 35.65007233330923,... 1 (POLYGON ((16.32652835456705 -5.87747039146621... 2 POLYGON ((20.59024743010491 41.85540416113361,... 3 POLYGON ((51.57951867046327 24.24549713795111,... 4 (POLYGON ((-65.50000000000003 -55.199999999999...
#Plot countriesIn [3]: world.plot();
Currently, the column named “geometry” with country borders is the active geometry column:
In [4]: world.geometry.nameOut[4]: #39;geometry#39;
We can also rename this column to “borders”:
In [5]: world = world.rename(columns={#39;geometry#39;: #39;borders#39;}).set_geometry(#39;borders#39;)
In [6]: world.geometry.nameOut[6]: #39;borders#39;
Now, we create centroids and make it the geometry:
In [7]: world[#39;centroid_column#39;] = world.centroid
In [8]: world = world.set_geometry(#39;centroid_column#39;)
In [9]: world
剩余内容已隐藏,支付完成后下载完整资料
资料编号:[466822],资料为PDF文档或Word文档,PDF文档可免费转换为Word
您可能感兴趣的文章
- Tienstra对等式约束平差解法的计算复杂性分析外文翻译资料
- 用NDWI和MNDWI方法检测城市地区地表水体的变化外文翻译资料
- 通过长时间序列COSMO-SkyMed SAR数据利用非线性PS-InSAR 方法揭示武汉的地表沉降状况外文翻译资料
- 基于时序Insar的伊朗库尔德斯坦大气相位屏估计外文翻译资料
- 利用Landsat数据对越南东北亚热带地区的农村城市化和土地利用变化进行监测和测绘外文翻译资料
- 用以代替精密水准测量的三角水准测量的研究与应用外文翻译资料
- 将航空斜图像与陆地图像相结合,以优化城市地区的建模外文翻译资料
- 基于卫星数据的1976-2016年黄河三角洲湿地景观格局动态变化外文翻译资料
- 三维城市模型在土地管理中的应用外文翻译资料
- 基于InSAR对热岩溶沉降进行遥感测量外文翻译资料


